Make Your Own Retirement Spreadsheet — Part II

Source: The Imitation Game
In the previous post, I suggested reasons why you might want to create your own financial planning spreadsheet, and described the nuts and bolts of setting one up. But there’s still the problem of choosing reasonable inputs and interpreting results in a way that gives you insight into your financial future — rather than leading you astray. In this post, I go over how to make the most effective use of your spreadsheet plan: how to handle inflation, what you might assume about investment rate of return, how to do sensitivity and what-if analyses, and how to check your results against other tools.
Inflation — What to Do With It
There’s little ambiguity about your current savings, income and expenditures – these are actual numbers that you know or can determine from your records. But what about the future? Should you be projecting numbers that include inflation? If so, what inflation rate should you use? And how should you think about the value of inflated savings 30 years or so in the future?
You can do your projection either way: in inflated (or nominal) dollars; or in current (or real) dollars. Nominal dollars represent what you might actually expect to happen, but have the disadvantage that future dollar values are not the same as they are currently. In fact, with modest 3% per year inflation, a dollar in 30 years would buy less than 50 cents would today! Real dollars, on the other hand, net out inflation, so that a dollar in 30 years is worth the same as a dollar today. This makes interpretation of long-term planning results a lot easier, since you don’t have to make a mental adjustment for decreased value.
While either approach is perfectly correct, I like to do my planning in real dollars. I think it’s simpler (no need to estimate inflation or build in escalating amounts for things likely to increase with inflation); and easier to interpret.
Whichever way you go, make sure you’re being consistent in your assumptions. Social security benefits, for example, are indexed to inflation (the CPI-U). If you are working in real/current dollars, you can project social security into the future as a level benefit at the same amount as the first year you receive it. If you’re working in nominal dollars, you should show Social Security benefits increasing over time, at some assumed average future inflation rate. Conversely, a level payment (such as a mortage payment) or income stream (say, an unindexed annuity) would work in the opposite way: you should project level amounts in future years under the nominal approach, but decreasing amounts if you’re working in real dollars.
By the way, it’s important to understand this distinction whether or not you create your own planning spreadsheet. When you’re looking at savings projections from online financial calculators, you need to understand whether you’re looking at results in inflated or uninflated dollars; there can be a huge difference. Most tools will tell you whether results are inflated or not, or give you the choice – but sometimes they don’t do either, which renders the software useless, in my opinion.
What Rate of Return to Use?
A primary function of your planning spreadsheet is to calculate how your savings will grow and compound over time. A critical assumption driving this growth is the rate of return you assume your investments will earn. But what rate of return (ROR) should you use? No one, of course, knows what returns stocks and bonds will bring in the future. Fortunately, over long periods of time (decades), the gyrations of the markets smooth out and returns become somewhat more predictable. Over the last hundred years, stocks have returned about 10%, on average, annually. Inflation has averaged 3%, so real returns have been about 7%. Bonds have returned about 5.5%, or 2.5% net of inflation (with much less volatility!). (Ibbotson ) Most investors will have a mixed stock and bond portfolio, which over the same time period would have returned about 8% nominal, or 5% real. (Vanguard)
So, should you just assume 5% real returns on your investments? If you are 30 years old, looking forward to many decades of working, saving, and investing, this would not be a bad assumption. However, for those in their 50s or beyond, a more conservative ROR assumption probably makes more sense, for the following reasons:
- Many experts believe returns over the next decade will be below historical averages, given the low interest rate on bonds and the high valuation (compared to history) of the stock market. (Waggoner, Benz, Perianan.)
- Most people won’t achieve pure market returns because they will keep some savings in cash (say, for a down payment or other near-term need), will incur management fees, or will pull investments in or out of the market at the wrong times in a counterproductive response to stock ups and downs. Studies have found that individual investors underperform the markets, although there is some disagreement about how big this gap really is. (Hallan, Roberts, Sommer.)
- Good retirement planning should be conservative so as to minimize unpleasant surprises. Most people would like to know that there’s a high probability that their money will last their lifetimes, so it makes sense to model something more conservative than average returns. The risk of poor or negative returns is very real; according to Vanguard, a 50% stock/50% bond portfolio would have lost money in 18 out of 93 years since 1926. In fact, the stock market has gone whole decades without any gain at all (most recently in the 2000s). Retirees especially need to protect themselves against sequence of returns risk – a string of bad returns early in retirement that depletes their portfolios so much that recovery is impossible even if/when good times return.
For all these reasons, it’s prudent to use a conservative real rate of return below 5% — say, 4% or even 3% (remember, this is still a 7% or 6% nominal return) — to model long-term investment returns in your planning, assuming you have a mixed stock/bond portfolio. It’s also very important to do sensitivity analysis to see how things would turn out under different rates of return, and to compare your results with online calculators that run probabilistic analysis .
More Tips
Keep it simple. Make your planning spreadsheet as simple as you can, while still providing the detail that you need. Keep the excruciating details of your annual budget and your million and one savings and investment accounts somewhere else; all you need for your planning spreadsheet are your bottom-line annual spending, income, and savings/investments amounts. A bit of granularity is useful; it’s helpful to break savings out into at least retirement (tax-advantaged) and non-retirement (taxable) buckets. Many people will also want to break out college savings. But resist the urge to add too many line items, bells and whistles; you will find that your simple, elegant spreadsheet can quickly become complex, unwieldy and confusing.
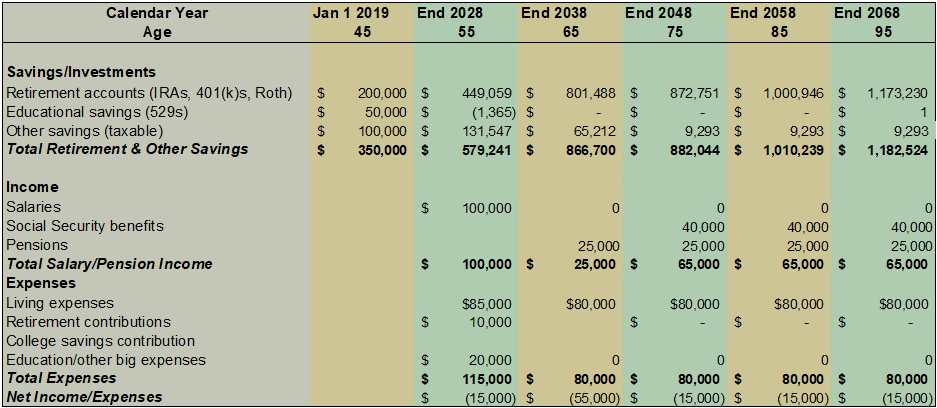
Display important outputs. Do you envy the cool graphs and displays that the online calculators have? Create your own! A simple approach is to hide columns so that you’re only looking at periodic, milestone results, as shown here:
Or you can build a summary table, such as the one displayed below, that allows you to see the essential results in your spreadsheet without taking ten minutes to scroll from one side to the other.

You can also create colorful charts that show information of interest – your total savings by year, your cash flow, or whatever else interests you. In the chart below, total liquid savings/investments are shown over time for the same apocryphal couple used as an example above and in the previous post:

Now your spreadsheet is starting to look a lot like those glitzy online software tools!
Update your spreadsheet regularly. You will need to maintain your spreadsheet. This can be as simple as sitting down once a year (New Year’s is a good time) and replacing the first column of estimated numbers with your current, updated savings and investments. Don’t erase the future or the past, just change the one column that is the year just past. At the same time, it’s a good idea to review whether any of your other assumptions need updating.
What about taxes? There are a number of different ways to handle income and property taxes. In my own version of this spreadsheet, I have different rates of return for tax-advantaged and taxable accounts, because I think it’s helpful to see the difference. In the income/expenditure section, you can (a) simply lump taxes in with other expenditures, (b) give them their own line item(s), or (c) try to have the spreadsheet calculate what your taxes are likely to be, based on your taxable income. (I tried this and eventually gave up – taxes are difficult to estimate based on just a few numbers.)
Beware negative compounding! Be careful about what happens if any of your savings/investment buckets go negative. If you’re not careful, your spreadsheet will continue merrily compounding negative returns until the cows home (or at least until age 95). In real life, of course, you would stop spending from the account that’s run dry and switch your withdrawals to a different account. One way to avoid this problem is to construct if/then formulas that stop the losses if an account falls to zero and switch future withdrawals to a different account.
Sensitivity Analysis and “What-if” Scenarios
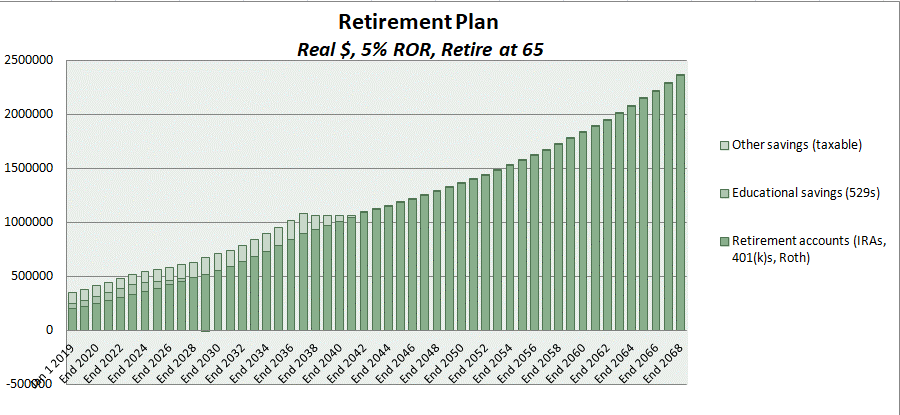
Now for the fun part! One of the great things about having your own planning spreadsheet is that you can do sensitivity analysis to find out which assumptions have the most impact on your plan. Perhaps the most important variable to test in this way is your assumed rate of return. For example, let’s compare long-term savings projections for our example couple using an optimistic 5% real rate of return (about average for a 50 to 60% stock portfolio historically):
… with a similar projection using a more pessimistic/conservative 3% rate of return:

Note the dramatic impact of a seemingly small difference in the rate of return. If your retirement plan looks good at 5% or 4% real return, but falls apart at 3%, that’s important to know. Once you’re aware of the risk, you can explore ways to create greater income certainty, such as deferring Social Security or purchasing retirement credits in a pension plan.
“What-if” scenarios are similar, but reflect choices you may be considering. Suppose you’re planning to retire at 65, but you’d secretly like to know whether you could retire earlier (a not uncommon question!). With your planning spreadsheet, you could examine alternative scenarios in which you retire at 62, 60, even 55. Or you might wonder how taking a one-year unpaid sabbatical would affect your retirement plans; go ahead and model a year without income. Many people have retirement dreams that involve big splurges — buying a beach home or sailboat or RV, or taking a year to do the Grand Tour. You can examine these scenarios, too. In fact, you can use your spreadsheet to examine almost any plan or hare-brained scheme you can dream up.
Below, we look at how it would work out if the example couple we have been following thus far retired at 60 instead of 65:
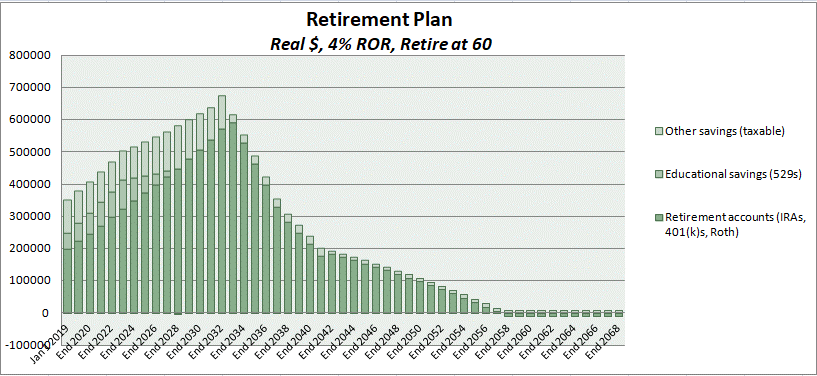
Ouch! Although they start out with a nest egg of almost $700,000, they run out of money in their mid-80s under our assumptions. (It’s actually even worse than it looks, since I cut the chart off at zero savings and don’t show them going deep into the red.) Looking at the critical decade from age 60 to 70 shows what’s happening in more detail:
Spreadsheet Excerpt, 4% Real ROR, Retire at 60
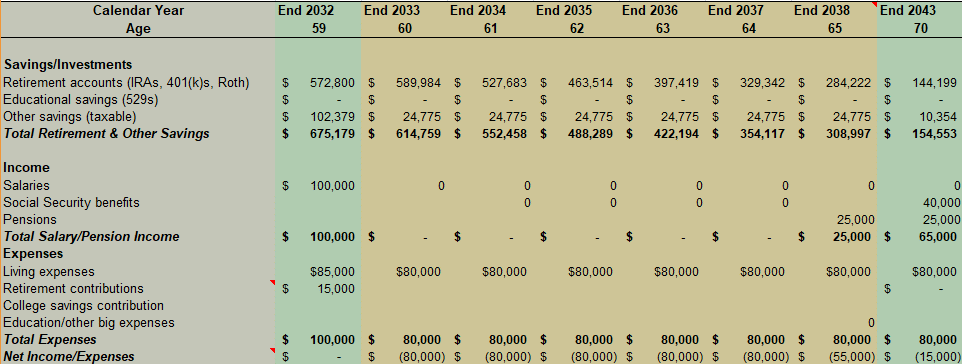
By 59, the eve of retirement, the couple has acquired a respectable nest egg of almost $700,000. Unfortunately, they need to spend $400,000 of it over the next five years until pensions start to kick in, and their savings are all the way down to about $150,000 by age 70, when they start collecting Social Security benefits. Clearly, this couple should not retire early, unless they have a way of reducing expenses substantially in retirement.
Use Other Tools Too
A planning spreadsheet, once you’ve got it set up and are confident it’s working correctly, is a powerful and flexible tool. Remember, though, that your spreadsheet can’t reproduce the variability and unpredictability of the actual market. It’s important to supplement your analysis with online calculators that do probabilistic historical and Monte Carlo analyses (see this post). This is especially vital for those of us close to or in retirement, who have to be concerned that we might be the unlucky ones who experience bad returns early in our own retirements. It’s always a good idea to cross-check your results with other planning tools, to make sure you’re not missing something important. And it’s fine to consult a financial planner now and then, too — just avoid the ones that want to charge you 1% of your assets!
Extra Credit
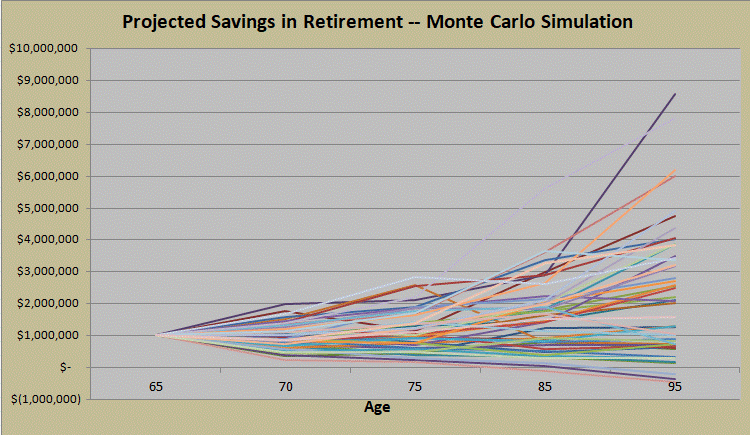
It’s not actually true that you can’t use a planning spreadsheet to do probabilistic analysis. If you’re interested, you can find YouTube videos that will show you how to “trick” Excel into doing a Monte Carlo simulation. (Just Google “Excel Monte Carlo analysis.”) You will need to do some research on historical rates of return for stocks and bonds, including their variability, to define a distribution from which random rates of return can be pulled into your spreadsheet thousands of times. I don’t necessarily recommend doing this, because it turns your simple spreadsheet into a black box, and it’s easy enough to find online sources that will do this analysis for you. Still, the geekier among you may find this an interesting challenge, and the exercise is quite educational. Here’s a graphical example of a Monte Carlo analysis, showing just a few of the 1,000 simulations run:
Conclusion
That’s it! I hope I’ve given the interested reader enough information – and encouragement – to enable you to start building your own planning spreadsheet. While I’ve presented it as a retirement planning aid, I think it is really something you can start early and keep up forever — a lifetime financial planning tool. When a colleague (today she would be considered part of the FIRE movement) showed me her planning spreadsheet several decades ago, it was a real light-bulb moment for me. For the first time, I understood that I didn’t need to depend on financial experts, that I could take control of my own financial destiny. I hope this post helps you take charge of your own financial future.
References
Hallam, Andrew. (2019, April 11). Are Investors as Dumb as this Study Says?, Asset Builder.
Morningstar, Inc. (2018) Fundamentals for Investors.
New York Life Investments. (2019) Ibbotson SBBI: Stocks, Bonds, Bills, and Inflation.
Sommer, Jeff. (2019, July 26). Investors Are Usually Wrong. I’m One of Them, The New York Times.
